Having increased the hardware available to run Succeed last Wednesday morning (1st October) due to the slow performance it has been interesting to look at the usage figures for the previous week (29th September – 3rd October) and compare them with the same week in 2013 (30th September – 4th October). To measure usage we will take logins per hour from the Portal (the main access route to Succeed). This excludes mobile and direct logins but should provide a reasonable basis for comparison. Also note that the figures quoted below are for one of the two applications servers (learnapp1).
Perhaps the most interesting figure that the peak number of logins per hour for 2013 was 591 and in 2014 – 1027, an increase of 73% – the 1027 logins occurred between 9.00-10.00am on Monday 29th September. Unsurprisingly such a huge increase in demand caused major problems with the servers. Over the week in 2013, there were 26,384 logins whereas in 2014 this increased by 16% to 30493. This increase was not evenly spread across the day but was concentrated in the 09-18 period. Logins across the week in the 09-18 window increased from 17749 to 21899 (23%).
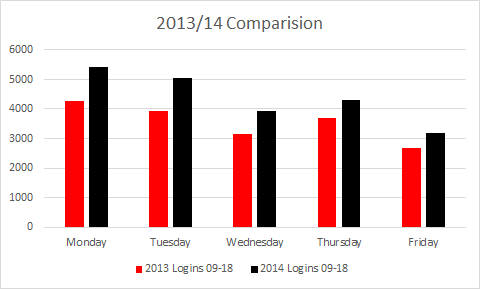
The graphic below shows the daily 09-18 logins for each day
As noted in the previous posting on performance, the additional processing power on the servers (8 processor cores to 12) should help Succeed handle the increased workloads that we experienced last week and fully expect to experience in the coming week!